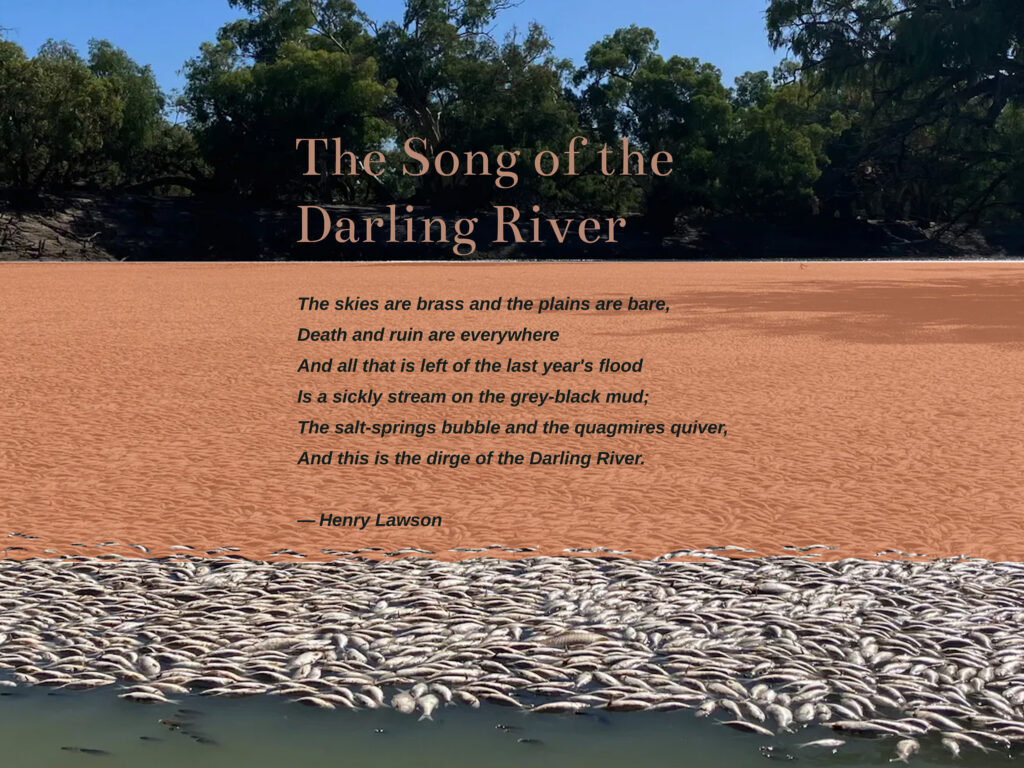
The skies are brass and the plains are bare,
Death and ruin are everywhere;
And all that is left of the last year’s flood
Is a sickly stream on the grey-black mud;
The salt-springs bubble and the quagmires quiver,
And this is the dirge of the Darling River.
— Henry Lawson
Henry Lawson’s poem, The Song of the Darling River, has come to be regarded as exemplificative of the cruel capriciousness of the Australian outback, where punishing droughts end in fleeting episodes of drowning deluge. The drought, once broken, is not long gone, and when it returns, it does so with remarkable alacrity.
The bush-poet’s ode to the vagaries of the Australian weather was inspired by Lawson’s visit to western New South Wales in 1892, where he encountered a parched landscape, and a resident population barely clinging to life. These scenes were all the more striking because only eighteen months earlier, much of the area had been covered by an inland sea, the result of several years of exceptional precipitation across the region.
But exactly how typical were these strikingly divergent conditions? Were those extreme floods, soon to evaporate into pools of mud, really the norm in the region?
Below, we will outline compelling evidence that challenges the notion of the flooding rains that inundated much of south-eastern Australia in the years before Lawson’s visit being a typical occurrence. Instead, it appears that one extraordinary event may have influenced the anomalous weather.
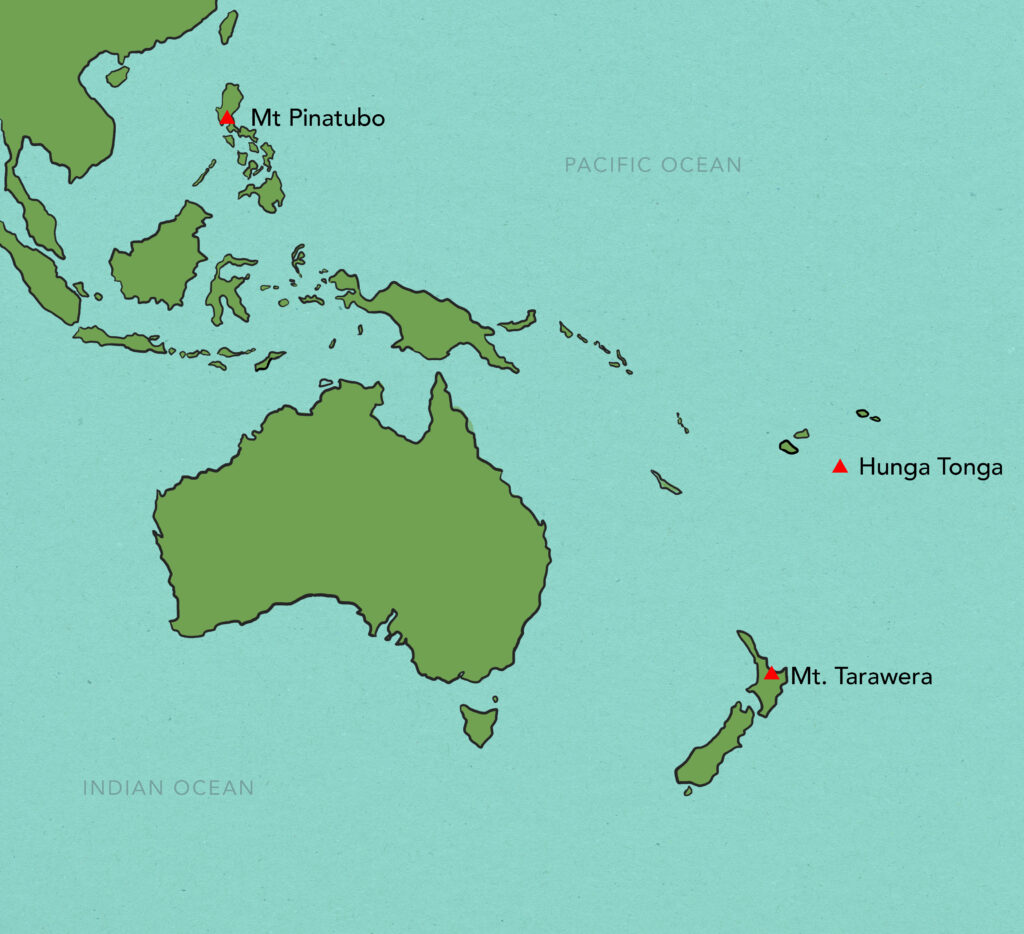
The signal event that we are referring to occurred in a location to the east of Australia, on the far side of the Tasman Sea: The eruption of the Mount Tarawera in 1886. This volcanic eruption stands as the most potent to take place in New Zealand in historic times.
The effects of such catastrophic volcanic activity can extend well beyond the immediate area of eruption, as one now largely forgotten physics professor realised in the late 20th century.
A century or so after Tarawera, Paul Handler, an emeritus physics professor at the University of Illinois, claimed that powerful volcanic eruptions, such as that seen at Tarawera, have an influence on weather patterns that can be both long-lasting and predictable, continuing to shape weather patterns for years after the initial event.
Many of Handler’s predictions regarding the weather effects of significant volcanic eruptions would prove to be remarkably prescient. After the massive eruption of Pinatubo in 1991, for instance, Handler correctly anticipated both the end of the Californian drought that spanned from 1987-1991 and the catastrophic flooding that swept across the Midwestern United States in 1993.
Given the significant volcanic activity that has taken place in the Southern Hemisphere at the advent of 2022, it may be an opportune moment to revisit Handler’s conclusions.
In January, 2022, a major volcanic eruption took place to the east of Australia, in an island in Tonga, the most powerful eruption to occur in this region since Tarawera.
In view of the belief of Paul Handler of a link between volcanic disturbances and certain weather patterns, the volcanic flare-up in Tonga elicits a number of pressing questions.
Could the weather patterns seen after the Tarawera eruption serve as an analogue for the long-term weather effects of the latest volcanic blow-up, perhaps providing a ‘weather warning’ as to the type of conditions that could be in store for Australia, and perhaps even further afield, in the next few years? Is it possible that such eruptions could even precipitate larger climatic shifts?
Finally, in keeping with the preoccupations of this site, we will also consider the implications of such celestial flux on the prices of agricultural commodities, ever so sensitive to the vagaries of weather and climate.
When Hunga Tonga-Hunga Ha’apai blew its top
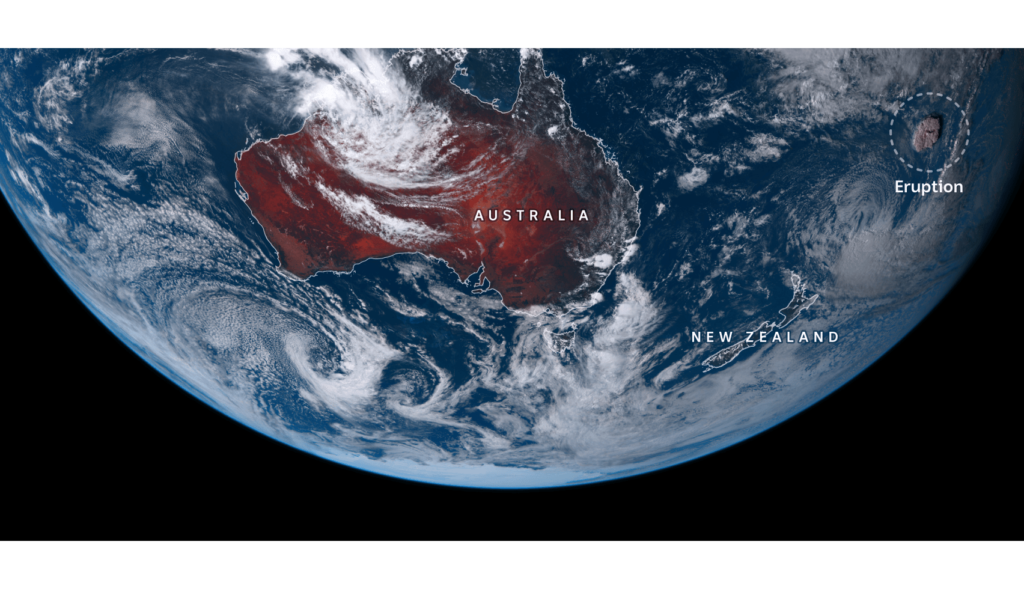
On the 15th of January, 2022, a massive submarine eruption tore apart what had been a pair of tiny islands, Hunga Tonga and Hunga Ha’apai, in the Pacific island nation of Tonga.
As well as covering nearby islands in ash, the vast explosive eruption triggered tsunamis and a shockwave so powerful that it sent ripples up into the planet’s ionosphere.(1)
The resulting tsunamis claimed four lives in Tonga and two more in Peru, but the secondary effects of the massive volcanic eruption may have wrought far greater devastation.
Following on from the devastating eruption, researchers studying its after-effects began to piece together a picture of its impact on the atmosphere. One shocking finding was that the eruption had released no less than 45 million metric tonnes of water vapor up into the earth’s atmosphere, resulting in a substantial increase in the amount of moisture in the global stratosphere.(2)
Following the eruption, numerous weather stations across South Queensland and Northern New South Wales recorded recorded-breaking monthly precipitation, and for approximately a year afterwards, significant flooding occurred throughout Eastern Australia and in the North Island of New Zealand.
Is it reasonable to suggest a causal relationship between the enormous plume of water vapor blasted high into the atmosphere by the Tonga volcano and the subsequent deluge that occurred in neighboring regions?
This suggestion would certainly marry with the arguments of Paul Handler, the late 20th century physicist who believed that major volcanic eruptions induce predictable patterns in weather systems.
Handler theorised that the vast quantities of gases and particulate matter released by powerful eruptions at low latitudes can have a significant impact on the earth’s climate, reflecting sunlight back into space and altering ocean currents.
Fate would deal Handler a perfect test-case for this theory, as a phenomenal volcanic eruption would shake the world just as his ideas were starting to garner some wider attention. (3)
The Weather-Seer of Illinois
On the 15th of June, 1991, Mount Pinatubo exploded, erupting in a fiery spectacle that would captivate the world.
The eruption of Mount Pinatubo, situated on the northern Philippine island of Luzon, was the most powerful volcanic eruption to take place on earth in nearly eighty years, and also the first truly powerful volcanic eruption to be extensively covered by the media.

Just six months after this earth-shaking eruption, at the annual meeting of the American Geophysical Union in San Fransisco, the then-retired physics professor from the University of Illinois, Paul Handler, would issue a prediction that would proved to be uncannily accuarate.
The eruption of the volcano, he claimed, would put an end to the drought that had been gripping California and the west coast of the United States for the previous four years.(4)
Handler was convinced that volcanic activity played a pivotal role in driving the El Niño weather phenomenon. He proposed that the aerosols emitted by volcanoes caused fluctuations in the temperature of the sea surface, which had a ripple effect on long-term weather patterns.(5)
Given the magnitude of the Pinatubo eruption, it was only natural that dramatic changes in the weather patterns were in store, or so he reasoned.
Less than two years later, Handler would also issue a warning of possible flooding of the Mississippi river in the summer of 1993, months before the event actualised.(6)
While the jury is still out on Handler’s suggestion that volcanic activity seeded El Niños, his forecast regarding the far-reaching impact of Pinatubo on weather of California and the Mid-Western United States certainly seems to have been accurate.
California, in fact, was to experience multiple years of extreme precipitation in the years after Pinatubo, with 1993, 1995 and 1998 all proving to be abnormally wet.
According to Handler’s analysis, a typical trend observed in the three years following a powerful volcanic eruption consisted of two very wet years, interspersed by one exceptionally dry year.
This pattern was in evidence in California in the wake of the 1991 volcanic eruption in the Philippines, with 1993(7) and 1995(8) both being very wet, and 1994 being unusually dry.(9)
As we will highlight below, Handler’s two-years-wet, one-year-dry pattern would also appear to conform quite neatly with the pattern of precipitation that was recorded by early weather stations across New South Wales in the years that followed the Mount Tarawera volcanic eruption almost one-and-a-half centuries ago.
The Flood in the Darling
In October and November of 2022, record rainfall across much of Victoria and New South Wales resulted in extensive flooding in the Murray-Darling river system. Hundreds of homes were inundated, and farmers in the region suffered extensive losses as vast tracts of farmland went under. (10) (11)
The flooding rains that would cause the Murray river to burst its banks in late 2022 had a curious echo of another meteorological cataclysm in an earlier chapter of Australia’s history.
Vast stretches of central and western New South Wales were similarly inundated in the late 19th century, with flooding rains pelting New South Wales in the late 1880s.
The year 1887 was particularly noted for its rainy weather, though in many locations the years 1889 and 1890 were still worse. (12)
This heavy downpour wasn’t all bad news. To most residents of this region, the rains were a welcome sight, heralding sweet relief from the drought conditions that had persisted into the early years of that decade. The sudden formation of a new inland sea created by the deluge allowed steam-boat captains to thrive, and trade boomed in many formerly isolated areas.(13)
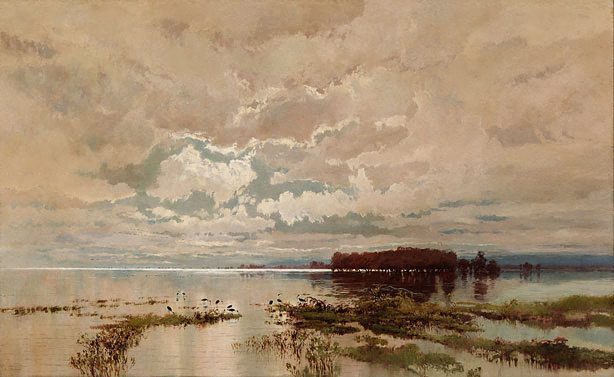
The aftermath of this inundation would also prove inspirational to one self-taught artist, William Charles Piguenit. The Tasmanian painter artfully captured the strangely serene aftermath of the floods in his 1895 work The flood in the Darling 1890, a majestic tribute to nature’s awesome power.
The deluge that was experienced across rural New South Wales came on the heels of a fiery calamity well beyond Australia’s eastern shore, at a mountain in New Zealand’s north isle called Tarawera, in the early hours of the 10th of June, 1886.
Over one hundred people were killed as a result of this disaster, and vast areas of the North Island were devastated, with layers of ash stretching for kilometres around the volcano, and waterways in the environs blighted by contaminants ejected by the volcanic blast.
The weather patterns evident across New South Wales in the wake of this terrible volcanic eruption across the Tasman line up quite well with the hypothesis that would be formulated by Paul Hander in the late 20th century.
Charting the evidence
Weather-stations were uncommon in Australia in colonial times, however, a small number of sites located around the state of New South Wales were operational by the time of the Tarawerra eruption. We will take a closer look at three of these now.
The charts below are based on the precipitation data recorded by three locations in the state in the late 19th and early 20th century: The Yancannia Station, the Binya Post Office, and the Wamberra Station.
The Yancannia station is located in the north-west of the state, not far from the border with Queensland. The Binya Post Office is based in south-central New South Wales, and Wamberra is located in the south-western corner of the state, not too distant from the Murray River that marks the border between New South Wales and Victoria.
The data from Yancannia is partly based on rainfall recordings by the early pastoralist William Reid, who also recorded the months with the highest incidence of rainfall.
The precipitation data recorded in all three locations in the wake of the June 1886 Tarawera eruption accords with the two-wet, one dry year pattern described by Paul Handler in the late 20th century.
In Yancannia, 1886 and 1887 were both very wet years, followed by a very dry year in 1888: as is evident in the chart below, this year would be the single driest year between 1880 and 1910, and a much later research report, released in 1971, indicated that 1888 had been the driest year on record. (15)
The waterless year of 1888, conspicuous in the chart below, was not some freak occurance specific to this remote station. Right across south-eastern Australia, the 1888 year earned the moniker the ‘Centennial Drought’, an appellation through which subsequent generations of farmers would recall this thirsty year.(16)
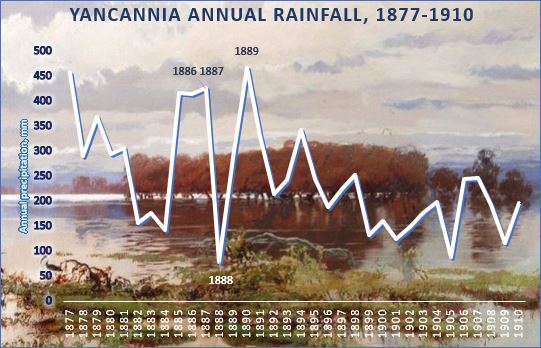
The year that followed, by way of contrast, was another extraordinarily wet year.
It is worth noting that, according to William Reid’s notes, the wettest month in 1886 was July, just a month after the New Zealand volcanic eruption. (17)
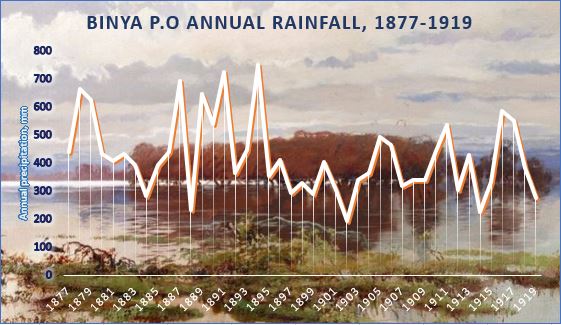
We find the same ‘big dipper’ pattern, centered on the same centenary year, in the data recorded in our other two NSW weather stations.
At Binya, for example, 1887 and 1889 were extraordinarily wet years, interpolated by one that was very dry. There would be two more extraordinarily wet years following on from this, with over 700 millimetres of precipitation recorded in 1891 and again in 1894, after which a long dry spell resumed.
Finally, we turn to the data from the Wamberra weather-station. This covers a longer time-frame than either Yancannia or Binya, but once again, the patterns fall in line with Handler’s observations.
At Wamberra, a wet year follows on from the year of the volcanic eruption, only to be succeeded by a very dry year, with that notorious year, 1888, being one of the driest on record.
The balmy weather would be short-lived, however. The following year proved to be the wettest on record for this location, as is clear on the chart below.
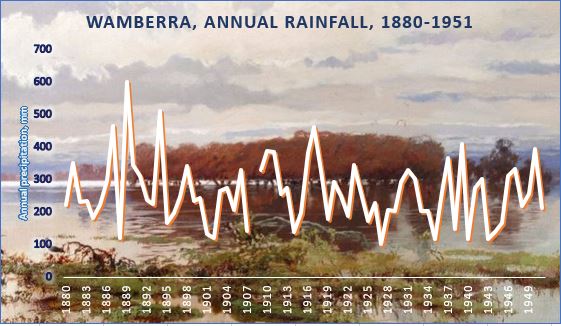
Once again, Handler’s two-one wet-dry pattern stands out quite clearly.
There is a possibility that Handler may have somewhat underestimated the intensity of the ‘volcanic rains’ that follow in the wake of major eruptions, as in the years following on from the Tarawera eruption, at least three years of excess precipitation were recorded in these three New South Wales weather stations, and a similar pattern of rainfall was evident in California in the aftermath of the Pinatubo eruption.
Do volcanoes cause El Ninos?
In the late 20th century, Paul Handler perceived a link between powerful volcanic eruptions in and around the world’s tropical zones and weather patterns in the United States, highlighting a peculiar pattern of two years of wet weather and one year of dry, a pattern that became apparent in California in the wake of the 1991 Pinatubo eruption.(20)
As has been noted here, intriguingly, that same ‘volcanic signature’ seems to occur in a number of weather stations in colonial NSW following on from of the Tarawera eruption in New Zealand in 1886.
This serves to indicate that major volcanic eruptions in the South Pacific might hold sway over the weather in Eastern Australia, in a comparable manner to the connection between low-latitude volcanic eruptions and weather in the United States that was noted by Handler.
In 2022, another powerful tropical volcano roared to life in the South Pacific archipelago of Tonga, not too far distant from Tarawera.
This leads us to ponder one of the key questions that was mooted at the commencement of this piece: having reviewed the findings of Paul Handler, is it possible to gauge the longer-term impact of this eruption on (a) the weather patterns in Australia and its environs, and (b) the United States?
This double-barreled question is not one that should be lightly brushed aside, as already, the weather-patterns in both regions seem to so far be falling in line with the patterns observed by Handler.
In March of 2023, for example, California found itself pummelled by relentless rains, borne across the Pacific along vast atmospheric rivers.(21)
Meanwhile, in the east of Australia, the year 2022 ended with flooding across the Murray river, and the new year was to bring with it still more devastating rains to the region, flooding parts of Queensland, and leading to extensive flooding in the North Island of New Zealand.(22)(23)
The weather patterns observed in the aftermath of the Hunga Tonga-Ha’apai eruption align with the historical precedents that have been highlighted in this article. However, it is worth noting one significant difference between this eruption and the other two examined in this article: the type of aerosols released into the atmosphere.
Handler’s studies focused on ‘El Chichón’ type volcanic aerosols, composed largely of sulfur dioxide, similar to those produced by the 1982 volcanic eruption of the same name. (24) Pinatubo, for example, mostly released sulfur dioxide, whereas initial assessments suggested that the Hunga Tonga eruption produced inappreciable volumes of stratospheric sulfur dioxide emissions.(25)
Nonetheless, the 2022 eruption discharged significant volumes of water vapor into the atmosphere, and the sulfur dioxide emissions may have been underestimated. Furthermore, in terms of explosive power, Hunga Tonga was truly exceptional. Volcanic eruptions are measured using the Volcanic Explosivity Index (VEI), which compares the total estimated volume of ejecta released.(26)
The jury is still out on where Hunga Tonga-Ha’apai sits on this scale, however, recent studies suggest that it was one of the most powerful natural explosions to occur on Earth in the last century. (27) It is therefore likely that the Hunga Tonga eruption was on par with the Pinatubo eruption.
In light of this, let us now take a leaf from Handler’s playbook, and estimate how things might fall into place, based on the historical precedents outlined above.
The location of Hunga Tonga-Ha’apai is unique, falling somewhere between Pinatubo and Tarawera but closer to the latter. Therefore, the 2022 volcanic eruption shares similarities with both eruptions. In terms of sheer explosive force, it matches Pinatubo, while in terms of location and sulphur-dioxide emissions, it approximates Tarawera.
First, we will turn to the United States, and consider the possible implications here.
United States
The recent volcanic eruption in 2022, similar to the earlier Pinatubo eruption, occurred in a country located near the equator.
Paul Handler found a strong correlation between major volcanic eruptions in such low-latitude regions and favourable growing conditions in the United States’ corn belt, a trend which he observed persisted for several years. This suggests that stronger crop yields might be expected in the agricultural heartland of the United States in the near future, barring any significant Midwestern flooding like that of 1993.
One notable difference between the recent eruption and Pinatubo is that the amount of sulfur dioxide released was much lower, although some researchers have estimated that it was comparable to a typical VE5-sized volcanic eruption such as Tarawera.(28)
Australia
Located in the South Pacific, and to the east of the Australian coast, Hunga Tonga-Ha’apai is agnate with the Tarawera volcano.
We thus find an intriguing analogue for the possibly weather-impacts in Australia as a result of the 2022 eruption, in the volcanic eruption of Tarawera in 1886.
We know from the early rainfall records of NSW that this eruption marked the commencement of a bout of wet weather in south-eastern Australia, the two years of wet, one year of dry pattern recorded by weather stations of the day seeming to marry closely with the later observations of Handler.
That might lead us to conclude that eastern Australia is in line for weather-patterns akin to those seen after the 1886 eruption. If so, then the flooding rains that inundated much of the region in 2022 and early 2023 may not be a one-off, with potentially serious implications for farmers and communities exposed to flooding.
That said, it must be borne in mind that a short but severe drought, comparable to that of 1888, might be also on the cards.
So, our historical analogues would suggest that wetter conditions are ahead, both for the east of Australia, and for the western United States. But here, we run headlong into the horns of a dilemma.
Eastern Australia and the West Coast of the United States have a tendency to experience contrasting weather patterns. When one region receives above-average precipitation, the other is likely to experience rainfall lower than the long-term average (‘El Niño’ and ‘La Niña’ phases). Although there are occasional exceptions, this pattern of divergence has been well documented.
How to reconcile this dilemma?
It might be worth focusing on if there are any meeting points between Handler’s theory and conventional meterological forecasts.
In order to reconcile this dilemma, we will concentrate the lens of our attention on the meeting of the waters, identifing potential junctures between Handler’s theory and conventional meteorological forecasts.
Handler’s theories, and the current meterological projections, would seem to concur in two respects.
1) Firstly, both would suggest that wetter conditions may be in store in the United States.
At time of writing, the conventional meteorological evidence points to a strong likelihood of a shift to an El Niño phase. This data adds weight to the suggestion of a transition to wetter conditions in the western United States, and an end to California’s three-year (2020-2022) dry streak. (29)
Handler argued that major volcanic eruptions in low-lattitudes provided the spark for a shift to an an El Niño phase, and the 2022 eruption of Hunga-Tonga should thus serve as an appropriate trigger for such a transition, based on this hypothosis.
2) A second overlap is that both theories indicate that Eastern Australia may be in line for a starkly dry year.
Hander argued that the weather patterns in the wake of major volcanic eruptions conformed to an idiosyncratic pattern, with a year of drought interspersed by two years of above average precipitation, a pattern that played out in Eastern Australia after the 1886 Terawera eruption.
Following on from a year characterised by flooding rains, Australia might thus be set for a consecutive year more in line with the severe 1888 ‘Centennial Drought’. Interestingly, some conventional forecasts also indicate that a strong El Niño might be in store, though it should be noted that this assessment is not universally held.(30)
Given that both Australia and the United States are major exporters of soft commodities, it is possible that the above scenario could present a ‘goldilocks’ scenario for grain production.
Even assuming a rapid shift to an El Niño phase, with dams full and rivers overflowing in Eastern Australia, many farmers in this corner of the Southern Hemisphere may be well placed to ride out a harsh, dry year.
In other words, both of the above scenarios might indicate that a shift to El Niño may not bode particularly poorly for agricultural production in either of these two key growing regions, and would generally provide a favourable backdrop for growers in the Mid-Western United States.
As the US is the largest exporter of corn in the globe, and the second largest exporter of wheat, wetter El Niño conditions may thus lead to softer grain prices over the next two-to-three years.
Lower prices of these important commodities should reduce food inflation globally, and assuming that this scenario pans out, this could be expected to lead to less food insecurity worldwide.
Throughout this analysis, we have highlighted two instances in which major volcanic eruptions appear to have had an impact on weather patterns: The Pinatubo eruption and its after-effects in California and the US Mid-West, and the Tarawra eruption and its effects on New South Wales.
In both California in the 1990s, and in New South Wales in the late 1880s, the pattern of precipitation accords to the signature pattern that was detailed by Paul Handler in the late 20th century.
Could the recent Hunga Tonga-Ha’apai eruption also have a similar impact on weather patterns?
It is a question has occupied the minds of climate scientists and meteorological experts ever since the cataclysmic eruption.
Although, at time of writing, it is deemed too be too early to assess the long-term impacts of this disaster on the weather in Australian, some potential impacts that have been mooted are a possible increase in summer rainfall in south-eastern Australia for several years, with the water vapour thrown up by the volcano possibly exerting an influence the powerful winds to the south of Australia, pushing it into a phase that is typically associated with higher rainfall.(31)
Scientists tend to be cautious by nature, and such forecasts are invariably come with caveats attached.
However, given the sheer volcanic power of the Hunga Tonga-Hunga Ha’apai eruption, and the known patterns that have transpired in the wake of such massive eruptions, it would feckless to assume that this volcanic eruption will prove to be the exception to the rule.
If the Pacific does dial back into an El Niño phase over the months ahead, then perhaps the eruption at Hunga Tonga may have been the earliest indicator of this shift. Paul Handler was certainly convinced that volcanic activity was linked to such shifts, and the eruption may have thus served as a warning-bell for the change in ocean conditions.
Special thanks to the Department of Physics at the Grainger College of Engineering, University of Illinois, for their kind assistance with this article.
Footnotes
(1) Tonga Eruption Sent Ripples Through Earth’s Ionosphere, NASA Jet Propulsion Laboratory, February 4, 2022, accessed 26 March 2023 (view link)
(2) Weisberger, M, 50 million tons of water vapor from Tonga’s eruption could warm Earth for years, Livescience, September 24, 2022, accessed 26 March 2023 (view link)
(3) Handler, P, The effect of volcanic aerosols on global climate, 1989, Journal of Volcanology and Geothermal Research, 37 (3-4), p 233-249, <https:://www.scopus.com/inward/record.uri?eid=2-s2.0-0024843898&doi=10.1016%2f0377-0273%2889%2990081-4&partnerID=40&md5=6f6cdc1aa04bb59ea9fbd2777258e539>, <https://www.sciencedirect.com/science/article/abs/pii/0377027389900814>(view link)
(4) Hecht, J, Science: Will Pacific hot spots wreak havoc with the weather?, New Scientist, January 11, 1992, accessed 26 March 2023 (view link)
(5) Joyce, C, Volcano clouds the picture on global warming, New Scientist, August 24, 1991, accessed 26 March 2023 (view link)
(6) Goering,L, PHYSICISTS’S THEORY LINKS FLOODING TO VOLCANO, Chicago Tribune, July 30, 1993, accessed 26 March 2023 (view link)
(7) Cannon,L, RAINFALL DROWNING FEARS OF DROUGHT IN CALIFORNIA, The Washington Post, February 13, 1993, accessed 26 March 2023 (view link)
(8) La Ganga, M.L & Dolan,M, Heavy Rains Set Off Mudslides, Floods as Storm Pounds State, Los Angeles Times, March 11, 1995 (view link)
(9) Muir,F.M, It’s Official: State Is Again in a Drought: Water: Winter precipitation was below levels seen during recent six-year dry period, Los Angeles Times, April 1, 1994 (view link)
(10) Yara Murray-Atfield, Emma Field & Mikaela Ortolan, Flood emergency ‘far from over’, Victorian SES warns, as swollen Murray River rattles border communities, ABC News, November 3, 2022 (view link)
(11) Lauren Pezet & Jessica Clifford, Body found in floodwater, man still missing as flood evacuation order warnings escalate across NSW, ABC News, November 3, 2022 (view link)
(12) Maiden, S, 1989, Menindee, First Town on the River Darling, The Sunnyland Press, Redcliffs, p 106
(13) Maiden, S, 1989, Menindee, First Town on the River Darling, The Sunnyland Press, Redcliffs, p 104
(14) (view link)
(15) Shaw, M T, 1987, Yancannia Creek, Melbourne University Press, Carlton, p 235
(16) Ritman, E.H M & Ashcroft, L.C REVISITING THE 1888 CENTENNIAL DROUGHT, Proceedings of the Royal Society of Victoria 132 , CSIRO Publishing, p 49-64, December 14, 2020 (view link)
(17) Shaw, M T, 1987, Yancannia Creek, Melbourne University Press, Carlton, p 234
(18) Australian Bureau of Meterology, Binya PO (view link)
(19) Australian Bureau of Meterology, Wentworth (Wamberra Station) (view link)
(20) Glassman, J.K, A VOLCANIC IMPACT ON THE NATION’S POCKETBOOK, The Washington Post, November 26, 1993, accessed 16 April 2023 (view link)
(21) Ramirez, R, Record snowpack, nearly full reservoirs: Here’s the state of California’s drought after an epic winter, CNN, March 27, 2023 (view link)
(22) Thomson, T, & Sinai, D, One year apart, Australia and New Zealand floods highlight the urgency of more holistic risk management, insurancenews.com.au, March 27, 2023 (view link)
(23) McCosker, M, & Felton-Taylor, A, Outback Queensland towns prepare to be cut off for weeks as floodwaters approach, ABC, March 21, 2023 (view link)
(24) Handler, P, & Handler, E. Climatic anomalies in the tropical pacific ocean and corn yields in the United States. Science., June 10, 1983; accessed 21 March 2023, 220(4602):1155-6. doi: 10.1126/science.220.4602.1155. PMID: 17818497.(view link)
(25) Sellitto, P, Podglajen, A, Belhadji, R et al The unexpected radiative impact of the Hunga Tonga eruption of 15th January 2022, Communications Earth & Environment 3, 288, November 19, 2022 (view link)
(26) King, H.M, Volcanic Explosivity Index (VEI) Geology.com, accessed 16 April 2023 (view link)
(27) Purkis, S.J, et al. The 2022 Hunga-Tonga megatsunami: Near-field simulation of a once-in-a-century event, Sci. Adv. vol 9, April 14, 2023 (view link)
(28) Schoeberl, M. R, Wang, Y, Ueyama, R, Taha, G, Jensen, E, & Yu, W. Analysis and impact of the Hunga Tonga-Hunga Ha’apai stratospheric water vapor plume, Geophysical Research Letters, 49, September 29, 2022 (view link)
(29) Saunders, T, El Niño in 2023 becoming more likely, which would result in dry, warm weather across eastern Australia, ABC News, April 21, 2023 (view link)
(30) Braun, K, Column: Forecasts start fast-tracking El Nino, though jury still out on ‘super’ event, Reuters, April 14, 2023 (view link)
(31) Logan, T, How the Tonga volcano eruption from 2022 may affect Australia’s weather for up to eight years, ABC News, February 16, 2023 (view link)